


Dear Australian Governments, please explain
Deaths in 2023 have been 13.0% above the ABS's 'baseline': we need to know why

Deaths in Australia are running at 13.0 per cent above the baseline used by the Australian Bureau of Statistics (ABS), yet most ordinary Australians have no idea that anything is amiss.
The ABS’s latest Provisional Mortality Statistics published on 22nd September give the figure of 13.0%, which equates to 10,289 more Australians dying than expected in the first six months of the year.
Deaths from covid only account for around a quarter of these excess deaths, as the reported covid death toll is 2,742 to the end of June. And we have to question why anyone at all is dying from covid among the vaccinated population, given what we were told - that the injections would protect us from severe disease and death.
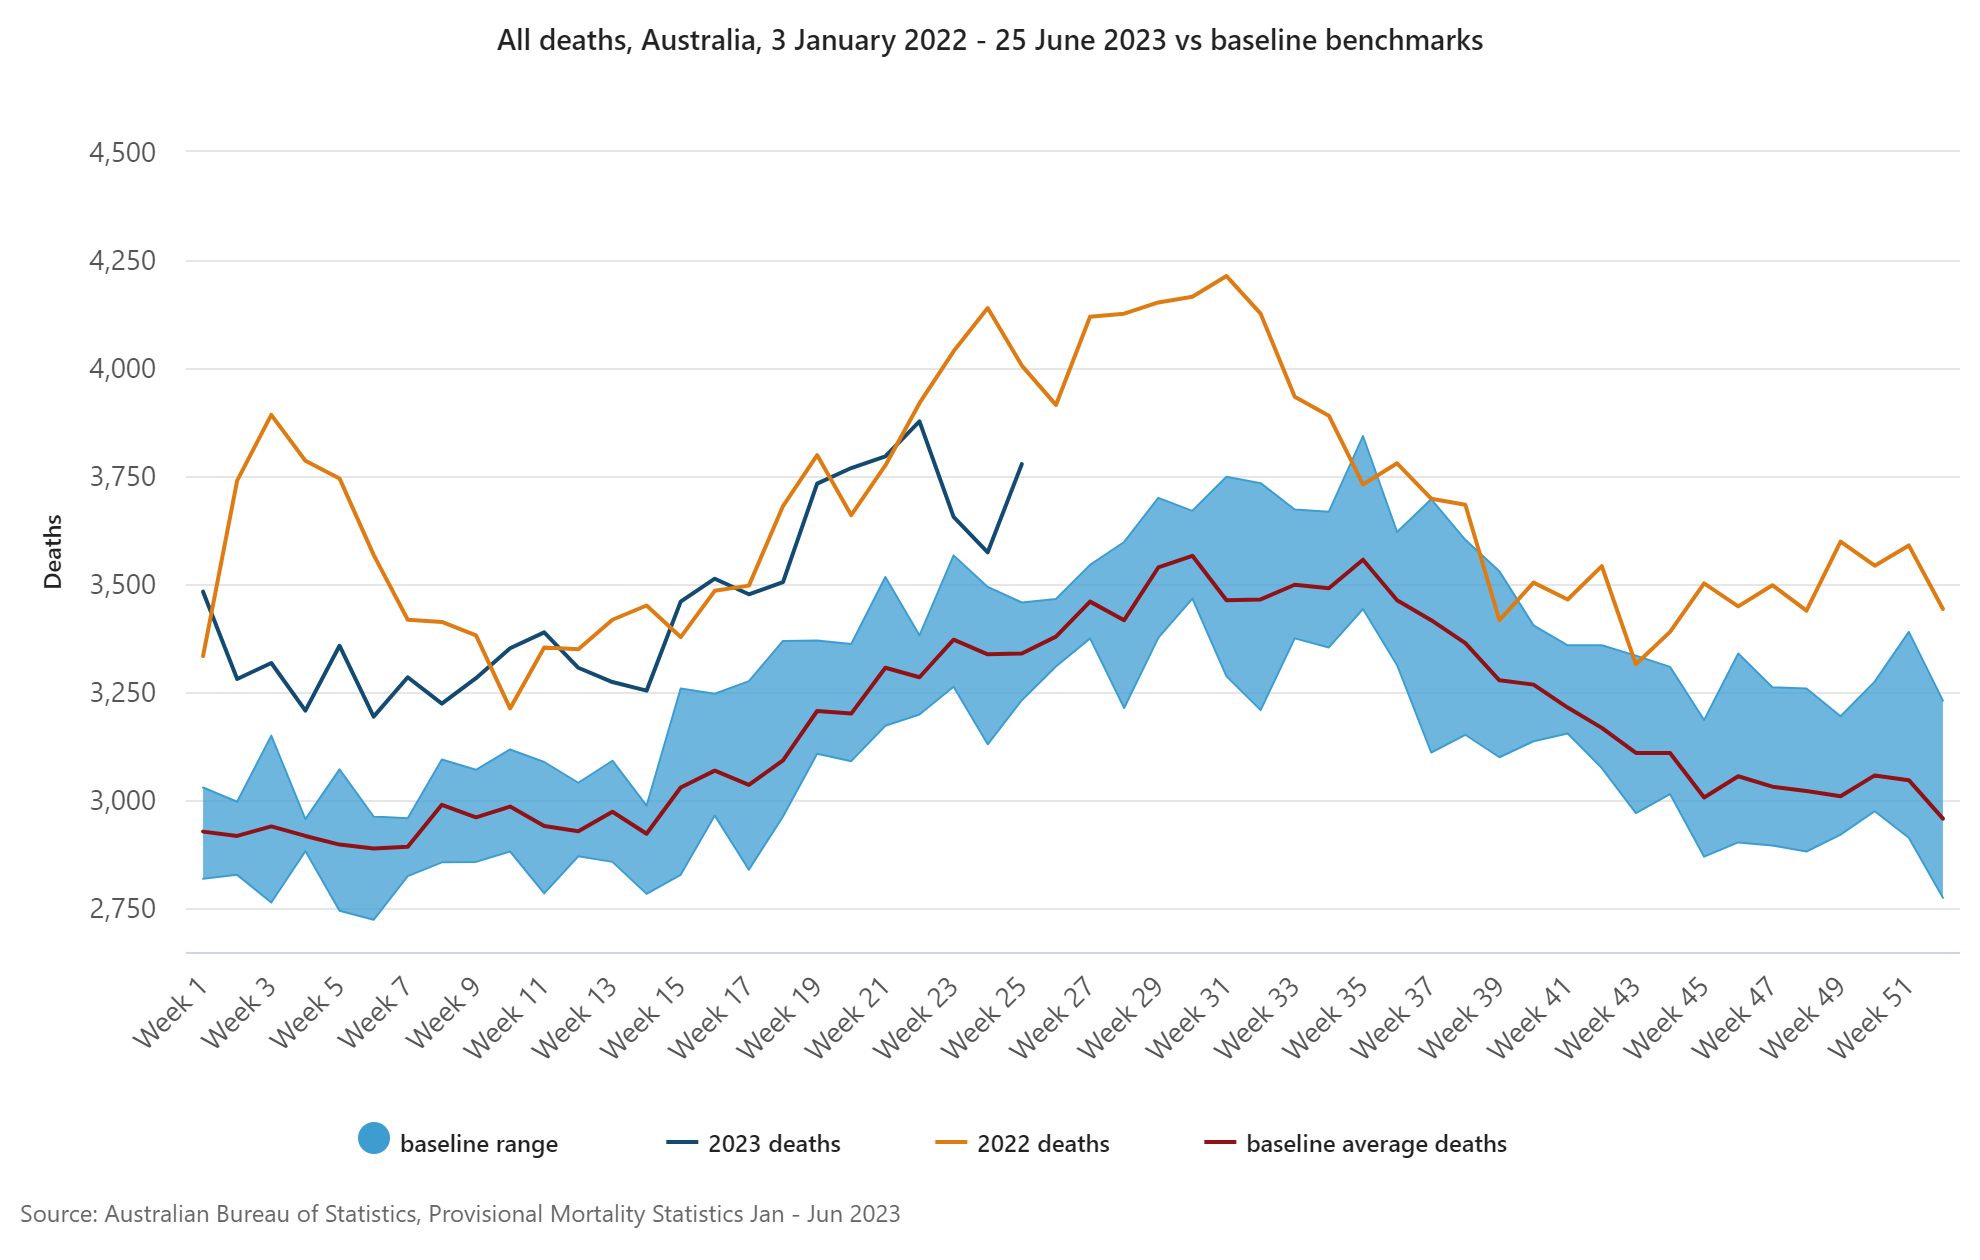
The graph above, produced by the ABS, shows clearly that deaths have been consistently higher than the ABS’s baseline (shown in red), which is the weekly average deaths for the four years 2017-2019 and 2021. (Incidentally, Clarity on Health (CoH) and others contend that the ABS’s baseline used in its Provisional Mortality Statistics for 2022 and 2023 is not logically defensible, but that’s another story.)
The blue shaded area on the graph is the “baseline range” - presumably ranging between the highest and lowest values seen over the four baseline years. As you can see, except for a handful occasions in late 2022, deaths have consistently been above the baseline range throughout 2022 and 2023.
One factor accounting for the increase in deaths is that our population grew by an estimated 5.3% to March 2023 compared to the average population in the baseline period1. If there are more people, there will be more deaths. However, because migrants are usually fitter, younger people and children, deaths are unlikely to rise directly in proportion to the population increase in the first couple of years after arrival.
Now, let’s do a ‘back of envelope’ calculation, giving those who say there is ‘nothing to see here’ the benefit of the doubt as much as we can. So, we’ll assume that about two fifths of the rise in deaths is due to population growth (5.3/13.0 = two fifths) and a quarter is due to deaths from covid. That still leaves about a third of these extra deaths - 3,352 lives lost - with no explanation.
CoH always likes to put deaths in perspective by turning them into plane crashes (thanks to Dr Ah Khan Sayed for this idea).
These unexplained deaths equate to 11 crashes of an Airbus A380-300 in the first six months of this year with the loss of everyone on board, with no explanation or investigation. Is that OK?

Which ABS model is better?
We’re in a strange situation at the moment, because there are two different models for excess deaths being used by the ABS. The first model (which we’ll call the ‘Simple model’) is the one we have been discussing, used in the Provisional Mortality Statistics publications, which, as mentioned, has some flaws, including modelling deaths rather than death rates.
To its credit, in July 2023 the Bureau produced what appears to be an improved model (which we’ll call the complex model) for measuring excess deaths. The complex model calculates expected deaths in 2023 by modelling age-specific death rates and fitting a model to data from 2013-2019. Modelling age-specific death rates (deaths per population in each age band) automatically adjusts for increases in population and even adjusts for changes in the age-profile of the population. And using a longer period that is entirely pre-pandemic is much more defensible than the current baseline being used in the Provisional Mortality Statistics.
While this model is an improvement in the ways mentioned above, CoH has yet to properly understand how the seasonality has been modelled. Deaths in many temperate parts of the world follow a seasonal pattern, with more deaths in winter, when, among other factors, flu is more prevalent and our immune systems are more vulnerable to it. At first sight, the ABS seems to have used a rather complicated approach to model this, but this may be justified.
And it’s important to remember that the complex model was provided by the ABS after there had been a known history of 18 months to two years of excess deaths. It’s therefore vital that all aspects of the model - its coefficients and the excess deaths it calculates by age-band and state - are made public so they can be scrutinised.
Results from the ABS complex model
The latest results from the complex model show there were 9.1% more deaths than expected in the first quarter of 2023. The graph below was obtained as a snapshot from the ABS website.

In this graph the blue shaded area represents 95% confidence intervals around the model predictions. When the mustard-coloured line (which is the number of actual deaths) is above the blue shaded region, then the level of excess deaths has reached a point where we need to ask whether something unusual is going on. This is particularly the case here because the mustard line stays above the blue shaded region for week after week.
The ABS itself is tells us in the report that there is statistically significant excess mortality when actual deaths are above the blue shaded area for TWO WEEKS or more:
“A single week above threshold does not necessarily suggest statistically significant excess mortality. Prolonged periods (2 or more weeks) where counts exceed thresholds suggest more strongly that the numbers of deaths are above or below normal.”
Thus, according to the complex model there have been excess deaths at a level we should worry about since late 2021. And, whichever model is used, we have alarm bells ringing that something unusual is happening, with excess deaths at concerning levels. In 2021, there were only the Provisional Mortality Statistics to warn the Government, but that should have been enough. Now two approaches are raising alarms but there is still no independent investigation into the causes of these excess deaths.
Why is nothing being done by Parliament?
On 24th March 2023, Ralph Babet, a United Australia Party Senator, moved:
That the Senate acknowledges that:
(a) there has been a concerning number of excess deaths in Australia in 2021 and 2022, as evidenced by recent all-cause provisional mortality data from the Australian Bureau of Statistics; and
(b) there is a need for further inquiry and scrutiny as to the reasons for these excess deaths, including why dementia and diabetes have seen significant increases in recent years
This motion was defeated by a single vote (30 Noes: 29 Ayes). You can see how individual senators voted here.
A further motion by Senator Babet, to set up a select committee to investigate the excess mortality, was conclusively rejected with 35 Noes: 4 Ayes. The reason for this was that most Liberal and National senators who voted ‘aye’ to the acknowledgement motion, abstained or voted ‘no’ to the motion to set up a select committee.
Perhaps the problem is that one explanation for the shape of the ABS graphs, with deaths consistently higher than pre-pandemic norms, is that the Governments’ responses to covid may have done more harm than good? But who would want a spotlight put on their own mistakes!
We must call for a truly independent investigation, ideally by a team that includes international experts with no conflicts of interest. It could be counterproductive if the people charged with investigating the covid response were in any way involved with deciding on, providing evidence in support of, or implementing that response.
What you can do
Each one of us can make a difference. Please share this post and talk to your friends and family when the opportunity arises, especially with people who have no suspicion that anything abnormal is going on. Every Australian needs to know that the death rate is around 10% higher than normal and remains stubbornly high. You can also help greatly by writing to your State or Federal MPs and the Federal Senators who represent your state or territory. You can find who represents you by using a tool which can be found on the Reignite Democracy Australia website.
Thank you for reading Clarity on Health. All our posts are free. Please share them. If you feel moved to support our work, consider becoming a paid member. You can cancel a monthly subscription at any time. Joining for one month gives a $5 donation, but you do need to remember to cancel!
Links
https://www.abs.gov.au/statistics/health/causes-death/provisional-mortality-statistics/latest-release Accessed 2nd October 2023
https://www.abs.gov.au/articles/measuring-australias-excess-mortality-during-covid-19-pandemic-until-first-quarter-2023 Accessed 2nd October 2023
https://www.aph.gov.au/Parliamentary_Business/Hansard/Hansard_Display?bid=chamber/hansards/26449/&sid=0017 Accessed 3rd October 2023
https://www.aph.gov.au/Parliamentary_Business/Hansard/Hansard_Display?bid=chamber/hansards/26448/&sid=0050 Accessed 3rd October 2023
Estimated resident population figures for June for 2017-2019 and 2021 and for March 2023 (he most recent available) were obtained from the ABS’s Time Series Workbook 3101.0 National, State and Territory Population accessed on 27th September 2023.
2 Pains at the same meeting in Canberra!
I wrote to my MP and he denies the dangers of the covd injections instead stating that they saved lives. The aeroplane juxtaposition is great. I continue to talk to people myself. Thank you again.